

Inteligencia para operar en los Mercados de Valores. Raise your Trading IQ !
31 ago 2012

MXP : Peso Mex, niveles claves/ Key levels for Mexican peso
Mencionamos aquí ayer la posibilidad que que el MXP se dirigiera hacia 13.44-13.55; el rango fue tocado brevemente y el día de hoy sera importante para saber si el soporte sera respetado o sera excedido. Suerte !.
We mentioned here yesterday the probability for the MXP to touch the 13.44-13.55 range; it was brevely touched and today it will be important to see if this range will work as support or will be exceeded. Good Luck !

We mentioned here yesterday the probability for the MXP to touch the 13.44-13.55 range; it was brevely touched and today it will be important to see if this range will work as support or will be exceeded. Good Luck !

30 ago 2012
EMini (ES) : 1401 y 1395 son los niveles claves / 1401 and 1395 the levels to watch
Mencionábamos aquí en la pre-apertura de los mercados los niveles importantes para el EMini (ES). Anexamos una gráfica actualizada. Hasta el momento el EMini ha respetado el nivel de 1395, si es excedido hay poco soportes en su camino a una caída importante (1392 y 1389 ). El camino alcista se ve mas difícil, con 1401 jugando un papel muy importante y varias resistencias en el camino. Suerte !.
We mentioned here at the pre-opening the key levels for the EMini for today. Attached an updated graph. As expected the E Mini has hold the 1395 level, but there is few support below it, we can see 1392 and 1389 only. They way up looks much more difficult, and will be determined by the upward breakout of 1401; but as you can observe in the graph there is a number of important resistance levels. Good Lucks !.

We mentioned here at the pre-opening the key levels for the EMini for today. Attached an updated graph. As expected the E Mini has hold the 1395 level, but there is few support below it, we can see 1392 and 1389 only. They way up looks much more difficult, and will be determined by the upward breakout of 1401; but as you can observe in the graph there is a number of important resistance levels. Good Lucks !.

Mexico better than Brazil : Demographic Trends in South America
Mas razones para preferir Mexico sobre Brazil en el futuro.
More reasons to choose Mexico rather than Brazil going forward.
Link : Demographic Trends in South America
More reasons to choose Mexico rather than Brazil going forward.
Link : Demographic Trends in South America
Forget Brazil; The Mexico ETF Is Hot (EWW)
August 27th, 2012
Brazil, which was once foreign investors’ favorite investment destination in Latin America, is currently facing some significant challenges. The country is expected to grow at just about 2% this year, a sharp reversal from 7.5% growth in 2010, primarily as a result of slowdown in China and recession in the Euro-zone.
On the other hand, Latin America’s second largest economy continues to put in a robust performance. Mexico’s economy grew at 4.1% for 2Q 2012 (tenth consecutive quarter of growth), though down slightly from 4.5% growth in the previous quarter. Growth has been driven by the increase in domestic consumption, supported by rise in job creation and expansion of bank credit. While credit as a percentage of GDP has doubled in Brazil to about 50% in last ten years; in Mexico, it is around 20%, indicating a significant room for expansion.
Mexico also benefits from rising manufacturing costs in China as some of the manufacturers shift production closer to home. Labor costs in China have risen by 12%-14% per year, in dollar terms, from 2002 to 2009; compared to about 1% in Mexico.Further shipping costs have also been rising and as a result some manufactures have shifted production to Mexico, where wages are still significantly lower than those in the US.
Brazilian stock market index Sao Paulo Bovespa has added just 2.9% this year while its Mexican counterpart IPC All-Share is up 8.5% year-to-date. Mexican peso is up about 6% against USD this year, while the Brazilian Real is down about 9% (partly due to central bank’s intervention).
The Bank of Mexico has kept the key rate unchanged at 4.5% since 2009 as the inflation has generally remained within its target range of 2% to 4%. The central bank expects the inflation to come down to 4% by the end of the year from 4.5% currently. Country’s foreign reserves have risen to $162.7 billion as of the end of June 2012.
Looking at the negatives, the country suffers from a high crime rate, drug-related violence and income inequality. About 46% of Mexico’s population lives in poverty (per World Bank) It remains to be seen whether the new government led by the President elect Nieto, which assumes power in December, will be able to take necessary steps to address these challenges.
iShares MSCI Mexico Investable Market Index (NYSEARCA:EWW)
EWW tracks the MSCI Mexico Investable Market index which consists of stocks traded primarily on the Mexican Stock Exchange. The index is a capitalization weighted index that aims to capture 99% of the total market capitalization.
Launched in March 1996, the fund now has more than $1.2 billion in AUM. The assets are invested in 42 holdings with an average market cap of $30.33 billion. Consumer staples (31.9%), telecom (23.9%) and materials (16.5%) are the top sectors that the fund is invested in. Growing consumer demand in the country suggests that the fund will benefit from its heavy exposure to consumer staples and telecom sectors.
The fund charges 52 basis points per year in expenses and currently has a 30-say SEC yield of 1.31%. The ETF has gone up 17.02% year-to-date.
The Grain Market and the State

The United States, Mexico -- which is currently chairing the G-20 -- and France held a conference call Monday to discuss a report requested by France on food prices. They also discussed whether G-20 states should hold an emergency Rapid Response Forum in order to coordinate trade policy on food amid a growing grain shortage. Countries and commodity traders all over the world are awaiting the mid-September release of the report, compiled by the Agricultural Market Information System, before they determine their next steps in dealing with the food crisis.
While farmers on the Indian subcontinent are still dealing with the consequences of a late monsoon season, the American heartland is experiencing the worst drought in more than half a century. As a result, wheat, corn and soybean prices are approaching all-time highs. Drought and flood conditions in Russia, Kazakhstan and Ukraine, along with the looming threat of wildfires in the Russian grain belt, are meanwhile provoking fears that the world's third-largest wheat producer will decide to ban exports -- as it did in 2008 and 2010 -- and pressure its grain-producing neighbors to do the same. This would leave grain consumers in politically volatile parts of the world vulnerable to harmful consequences.
Though the hit to the grain markets so far does not appear to be as severe as the food crisis four years ago, G-20 leaders are trying to avoid exacerbating the current situation; they are encouraging trade policymakers around the world to keep cool heads and avoid the kind of market speculation and food hoarding that will dwindle supply, drive up prices even further and lead to food riots. But food policy is not particularly conducive to a multinational, good-faith effort. There's a reason why the G-20’s Rapid Response Forum doesn't have the authority to issue anything beyond recommendations.
The grain trade represents geopolitics in its most primal form. People need food to eat. States need to grow and distribute food to feed their people. States with naturally integrated river systems and abundant farmland have a much easier time feeding their people and supplying overseas markets. Even in times of severe drought, the lands fed by the arterial Mississippi River generate massive supplies of staple grains for the United States and its global clientele. States with harsh climates, poor soil and uncompromising geography between their farmland and population centers will generally have a much harder time keeping their populations fed and will thus have to resort to more extraordinary measures to hold onto power.
Russia's urban core lies in Muscovy on the North European Plain, while the Russian breadbasket, supported by the Volga River, lies farther south, from the Black Sea across the northern Caucasus to western Kazakhstan. A Ukrainian or Kazakh farmer in the southern grain belt isn't likely to relate to Moscow the way an urban resident of Saint Petersburg does, which means sometimes extreme measures have to be taken to ensure that food reaches markets. In the 1930s, Joseph Stalin collectivized peasant farms and literally starved the countryside. Today, Russia has created a Customs Union to try to fold Ukraine, Kazakhstan and Belarus into a trading bloc that would give Moscow heavy influence over the grain trade in the former Soviet periphery. By establishing control over these countries' wheat exports, Moscow would effectively control 15 percent of global wheat production and 16 percent of global exports. There is a reason why Lenin at one time referred to grain as "the currency of currencies."
When food supply is in question, it is very difficult to imagine any state putting another state's interests before its own. In the same way that Russia banned wheat exports in 2010, India banned rice exports in 2008; meanwhile, large delegations of Arab and Asian businessmen have been buying up farmland abroad in an effort to procure a safety net for their own countries' food production. A state will do whatever is necessary to feed its people, without much regard for needs elsewhere around the globe.
These kinds of food scares will be a chronic occurrence for the next decade or so. Weather fluctuations, biofuels development and food stockpiling for growing populations will continue to stress a global food supply produced by only a handful of major grain exporters. Technological advancements have improved crop yields and expanded global trade in foodstuffs. This has allowed the kind of development that has fueled population growth so rapidly that developing countries have outstripped their own production capacity, leaving them all the more vulnerable to unexpected fluctuations in the grain markets.
A more extended look into the future, however, may paint a different picture. Birth rates in much of the world are collapsing, as urbanization is leading women to have fewer babies and at older ages. The developing world is only three generations behind the developed world in this trend. The world is not destined to see ever-increasing population growth outstrip the global food supply. With more manageable populations, states will regain some capacity to manage their food sources, making them less vulnerable to seasonal fluctuations and the political whims of major grain exporters. Until then, summits to coordinate global food policy will likely be called for and held in vain


September : Still the worst performing month since 1950

By Christopher Mistal & Jeffrey A. Hirsch
Since 1950, September is the worst performing month of the year for DJIA, S&P 500, NASDAQ (since 1971), Russell 1000, and Russell 2000 (since 1979). September was creamed four years straight from 1999-2002 after four solid years from 1995-1998 during the dot.com bubble madness. Bullish election-year forces do little to improve on September’s poor overall performance over the same timeframe. September’s performance does improve slightly in election years, but it is still negative nearly across the board. Only the small caps of the Russell 2000 have been able to escape negative territory and post a modest 0.4% average gain in the last eight election year Septembers.
Although the month has opened strong 12 of the last 16 years, once tans begin to fade and the new school year begins, fund managers tend to clean house as the end of the third quarter approaches, causing some nasty selloffs near month-end over the years. Recent substantial declines occurred following the terrorist attacks in 2001 (Dow: -11.1%) and the collapse of Lehman Brothers in 2008 (Dow: -6.0%). Solid September gains in 2010; DJIA’s 7.7%, S&P 500’s 8.8% were the best since 1939, but the month suffered nearly the same magnitude declines in 2011, confirming that September can be a volatile month.
September Triple Witching week has a modest bullish bias with gains more often than not, but a 14.3% DJIA loss in 2001 has the week negative on average. All five indices have recorded gains on Monday of expiration week for three straight years. Triple-Witching Friday has been strong the past eight years with every index advancing that day except the Russell 2000 (its streak is seven years). The week after Triple Witching has been brutal, down 17 of the last 22, averaging a Dow loss of –1.2%. DJIA suffered its worst week-after loss of 6.5% in 2011.
In recent years, Labor Day has become the unofficial end of summer and the three-day weekend has become prime vacation time for many. Business activity ahead of the holiday was more energetic in the old days. From 1950 through 1977 the three days before Labor Day pushed the DJIA higher in twenty-five of twenty-eight years. Bullishness has since shifted to favor the two days after the holiday as opposed to the days before. DJIA has gained in 13 of the last 18 Tuesdays and 13 of the last 18 Wednesdays following Labor Day.
29 ago 2012

US$9 Trillones esperando el momento adecuado / US$9 Trillion waiting for the right moment
Los depositos en lo bancos comerciales estan cerca de alcanzar los 9 trillones de dolares. Liquidez no es es problema de la economia...
Cash deposits at US commercial banks about to reach 9 trillion. Liquidity is not the issue.

Cash deposits at US commercial banks about to reach 9 trillion. Liquidity is not the issue.


28 ago 2012
Un rally de bajo volumen / A low volume rally
Desde la minima de Marzo del 2009 el S&P ha subido 108.5%, mientras que el volumen promedio de 21 dias se ha reducido en 58.59%. Suerte !
From the low in March 2009 to date the S&P has increased by 108.5%, while the daily 21 days average volume has decreased by 58.59%. Good Luck !

From the low in March 2009 to date the S&P has increased by 108.5%, while the daily 21 days average volume has decreased by 58.59%. Good Luck !

Euro : Rebota pero respeta resistencia / A Rebound that meets resistance
Necesitamos ver que se exceda de manera contundente el rango de 1.2555-1.2582 para poner en juego el siguiente nivel. De la misma manera 1.2490 es un soporte importante que debe ser excedido de manera contundente para poner en juego 1.2425. Suerte !
The Euro will need to exceed 1.2555-1.2582 in a convincing manner if it is going to go up. On the downside 1.2490 will habe to be broken to target 1.2425. Good Luck !

The Euro will need to exceed 1.2555-1.2582 in a convincing manner if it is going to go up. On the downside 1.2490 will habe to be broken to target 1.2425. Good Luck !


Viernes Dia D, veremos un QE3 o no? / Friday is D day, to QE or not to QE
El foco de los mercados en las próximos dias estará centrado en los bancos centrales de Europa y los EE.UU.. El presidente de la Reserva Federal (Fed), Ben Bernanke, hará su discurso anual en Jackson Hole este viernes, hay expectativas muy altas de un anuncio de estímulo adicional (QE 3), especialmente por el tono de las minutas de la Fed de la semana pasada. Estas expectativas de una flexibilización cuantitativa (QE) adicional pueden decepcionar los mercados ya que los datos económicos estables/positivos de la economía de Estados Unidos harán más difícil la justificación de un QE adicional. Lo que si se espera es una confirmación de parte de Bernanke de la intención de la Fed de mantener las tasa de interés en sus bajos niveles actuales hasta 2015.
Mientras tanto, los datos económicos de Europa continúan debilitándose como consecuencia del precio que las economías están pagados por el “camino” de la austeridad que han decidido tomar para resolver la crisis de la deuda. Incluso Alemania esta siendo afectada y recientemente el Índice IFO de agosto mostro l por cuarto mes consecutivo su nivel más bajo desde marzo de 2010.Es probable que el BCE, que ya se está preparando un programa de compra de bonos y la revisión de su marco de garantía para estabilizar los mercados de deuda de la zona euro, también este contemplando un programa de QE; la inflación ha dejado de ser un obstáculo para la implementación de una política monetarias mas relajada, la que podría ser en forma de recortes de tasas o no-esterilización de las compras de bonos.
Creemos que los mercados ya han descontado un mayor estímulo de la Reserva Federal y compras importantes de bonos por parte del BCE, la falta de estímulos adicionales de parte de la Fed o el BCE va a defraudar a los mercados.
-------------------
The focus of markets over the coming days will be firmly on the central banks of Europe and the US. The Chairman of the Federal Reserve (the Fed), Ben Bernanke, is due to make his annual Jackson Hole speech on Friday, with expectations of the announcement of further stimulus heightened by the dovish Fed minutes released last week.These expectations for further quantitative easing (QE) may be disappointed as firmer US data may make further QE difficult to justify. At the very least, though, Chairman Bernanke is likely to confirm the Fed’s intention of keeping rates low until 2015.
Meanwhile, data from Europe continues to weaken as the ongoing debt crises takes its toll onthe real economies. Even Germany is not immune with the August IFO Business Index falling for the fourth month in a row in August to its lowest level since March 2010, driven by a fall in the expectations component. The ECB, who is already preparing a bond buying programme and revising its collateral framework to stabilise euro area debt markets, is likely also to be contemplating ways to ease monetary policy as risks to inflation start to materialise on the downside. This could be in the form of further rate cuts or non-sterilisation of bond purchases.
Markets have already priced in further stimulus from the Federal Reserve and significant bond purchases by the ECB, failure to deliver from either will disappoint.
27 ago 2012
GLD : Oro rumbo a 1750? / Gold towards 1750?
Mencionamos aquí en Ago-20 la posibilidad de que el oro rompiera a la alza la formacion de triángulo que ha venido formado desde Mayo. El triángulo ha sido excedido a la alza poniendo como objetivo 1700, con la posibilidad de continuar hacia 1720, aquí podremos ver un periodo de consolidación que tiene la posibilidad de continuar hacia 1750-1770. Para ver un cambio de dirección tendríamos que ver un rompimiento convincente de 1640 a la baja. Suerte !
We mentioned here on Aug-20 the possibility for gold to break the triangle formation that has been put in place since May. We are on the 5th consecutive up/consolidation day. Next targets are 1700 and then 1720, we may see a consolidation in this area before continuing to reach 1750-1770. In order to see a change of trend, we will like to see a break of 1640 to the downside. Good Luck !

We mentioned here on Aug-20 the possibility for gold to break the triangle formation that has been put in place since May. We are on the 5th consecutive up/consolidation day. Next targets are 1700 and then 1720, we may see a consolidation in this area before continuing to reach 1750-1770. In order to see a change of trend, we will like to see a break of 1640 to the downside. Good Luck !


Quien se beneficia de la debilidad del Euro? / Who benefits from a weak Euro?
Irlanda, Belgica, Holanda, Alemania...
Ireland, Belgium, Netherlands, Germany.....

Ireland, Belgium, Netherlands, Germany.....

24 ago 2012
EMini (ES) : Niveles claves para hoy / Key Levels for today
Estos fueron los niveles que comentamos aqui ayer para el EMini (ES), todos se comportaron como se esperaba y siguen siendo validos para hoy.
These were the key levels mentioned yesterday here for the EMini (ES), all have played as expected and they continue to be valid today.

These were the key levels mentioned yesterday here for the EMini (ES), all have played as expected and they continue to be valid today.

Euro (EUR) : Comportandose como esperabamos / Behaving as expected
Mencionamos aqui el 22-Ago los niveles claves para el Euro, estos niveles han sido respetados y una vez que se excedio 1.2490 se topo con la resistencia en 1.2555 - 12582 para regresar a probar 1.2490, esta vez como soporte. Si 1.2490 es excedido a la baja, se pone en juego 1.2425-1.2430 y despues 1.2364 que ha sido y seguira siendo un nivel importante para definir tendencia de corto plazo.
We mentioned here on Aug-22 the key levels for the Euro, well the levels have played a key role as expected, once 1.2490 was exceeded the 1.2555-1.2582 resistance was reached, from there the Euro came back to 1.2490, this time testing it as support. If 1.2490 is broken down then 1.2425-1.2430 and then 1.2364 will be put in play. 1.2364 has been a key level to define short term trend.

Probabilidad que los mercados suban hoy / Probability that markets will go up today

Dow 57.1%
S&P 61.9%
Nasdaq 47.6%
El % de probabilidad que los mercados suban hoy esta basado en el numero de veces que el mercado ha subido los ultimos 21 años (1990-2010).
The % of probability that markets will go up today is based on the number of times the markets has gone up during the last 21 years (1990-2010).

23 ago 2012
SLV : Plata rompe y alcanza objetivo / Silver breaks and reaches target
Mencionábamos aquí la semana pasada la posibilidad de que la Plata , también mencionamos aquí el 29-Julio que el rompimiento en cualquiera de las direcciones iba a ser brusco...aja ! ver gráfica anexa. Ahora estamos ajustando el objetivo 50c de máxima de 30.50 a 31.00. Si 31 es excedido el siguiente objetivo sera 31.75-32.25. Suerte !
Last week we mentioned here the possibility for silver to break up, well it has happened and the expected target has been reached. We also mentioned here on Jul-29 that the breakout in either direction was going to be violent... alas ! see graph below. Now we are making a minor adjustment of 50c to the maximum of this leg, from 30.50 to 31.00. If 31.00 is exceeded the next target will be 31.75- 32.25. Good Luck.

Last week we mentioned here the possibility for silver to break up, well it has happened and the expected target has been reached. We also mentioned here on Jul-29 that the breakout in either direction was going to be violent... alas ! see graph below. Now we are making a minor adjustment of 50c to the maximum of this leg, from 30.50 to 31.00. If 31.00 is exceeded the next target will be 31.75- 32.25. Good Luck.


Seasonality : Dow behaviour on election years (1900 - 2008)
Not a perfect match the 1Q, but very good match on the 2 and 3Q of this 2012.
Good Luck !

Good Luck !

Market's Bill of Health Long-term trend improves to bullish, sector rotation in full swing | Chris Puplava | FINANCIAL SENSE
Not necessarily agree, but here it goes, a very technical point of view :
Market's Bill of Health Long-term trend improves to bullish, sector rotation in full swing | Chris Puplava | FINANCIAL SENSE
Market's Bill of Health Long-term trend improves to bullish, sector rotation in full swing | Chris Puplava | FINANCIAL SENSE
22 ago 2012
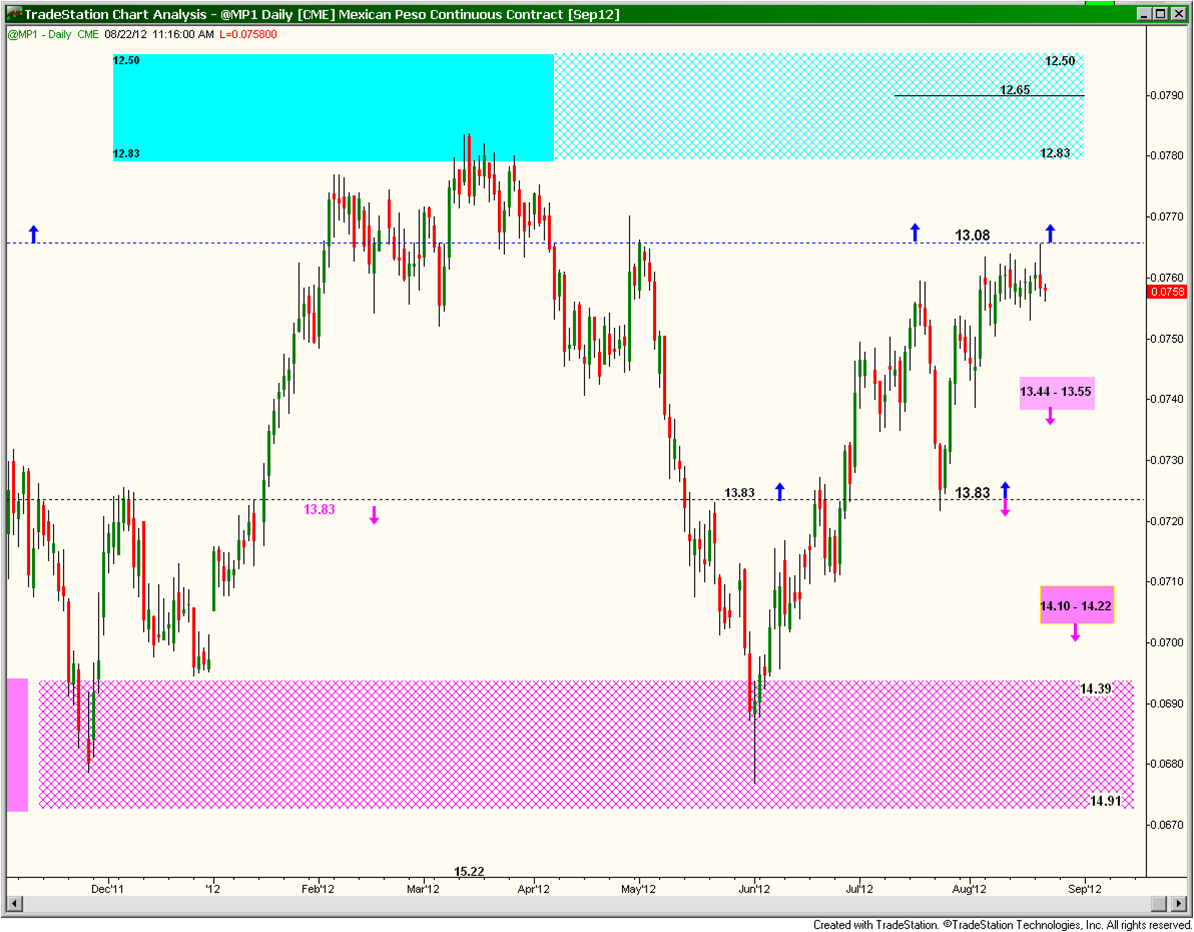
MXP : Peso toca importante resistencia / Peso reaches key resistance
Hemos venido mencionando desde hace tiempo aquí, aquí y aquí la importancia de los niveles 13.08 y 13.83, durante los últimos días el peso se ha consolidado alrededor de 13.08 sin excederlo. Nos inclinamos por que esta resistencia sea respetado y veamos hacia adelante mayor debilidad dirigiendose hacia 13.83, pasando antes por 13.44 - 13.55. Suerte !
We have mentioned here, here and here the importance of 13.08 and 13.83 for the mexican peso. Over the las number of days the resistance level at 13.08 has played an important role and has not been exceeded. We do not expect the 13.08 level to be exceeded and we favour weakness that should take the peso to 13.83, after a short consolidation in 13.44 - 13.55. Good Lucks !

Apple (APPL) : La mayor empresa por capitalizacion bursatil en la historia / Largest co. by market cap in history
Apple se ha convertido oficialmente en la mayor empresa por capitalización bursátil de la historia. La siguiente tabla muestra algunas otras empresas junto con sus capitalizaciones de mercado máximas.
Apple has officially become the largest company by market capitalization in history. The table below highlights some other companies along with their peak market capitalizations.
Apple has officially become the largest company by market capitalization in history. The table below highlights some other companies along with their peak market capitalizations.

21 ago 2012
Soros Unloads All Major Financial Bank Stocks; Invests Over $130 Million In Gold
 In a harbinger of what may be coming our way in the Fall of 2012, billionaire financier George Soros has sold all of his equity positions in major financial stocks according to a 13-F report filed with the SEC for the quarter ending June 30, 2012.
Soros, who manages funds through various accounts in the US and the Cayman Islands, has reportedly unloaded over one million shares of stock in financial companies and banks that include Citigroup (NYSE:C) 420,000 shares, JP Morgan (NYSE:JPM) 701,400 shares and Goldman Sachs (NYSE:GS) 120,000 shares. The total value of the stock sales amounts to nearly $50 million.
What’s equally as interesting as his sale of major financials is where Soros has shifted his money. At the same time he was selling bank stocks, he was acquiring some 884,000 shares (approx. $130 million) of Gold via the SPDR Gold Trust (NYSEARCA:GLD).
Understanding Mexico's Strategy
By George Friedman

A few years ago, I wrote about Mexico possibly becoming a failed state because of the effect of the cartels on the country. Mexico may have come close to that, but it stabilized itself and took a different course instead -- one of impressive economic growth in the face of instability.
Mexican Economics
Discussion of national strategy normally begins with the question of national security. But a discussion of Mexico's strategy must begin with economics. This is because Mexico's neighbor is the United States, whose military power in North America denies Mexico military options that other nations might have. But proximity to the United States does not deny Mexico economic options. Indeed, while the United States overwhelms Mexico from a national security standpoint, it offers possibilities for economic growth.
Mexico is now the world's 14th-largest economy, just above South Korea and just below Australia. Its gross domestic product was $1.16 trillion in 2011. It grew by 3.8 percent in 2011 and 5.5 percent in 2010. Before a major contraction of 6.9 percent in 2009 following the 2008 crisis, Mexico's GDP grew by an average of 3.3 percent in the five years between 2004 and 2008. When looked at in terms of purchasing power parity, a measure of GDP in terms of actual purchasing power, Mexico is the 11th-largest economy in the world, just behind France and Italy. It is also forecast to grow at just below 4 percent again this year, despite slowing global economic trends, thanks in part to rising U.S. consumption.
Total economic size and growth is extremely important to total national power. But Mexico has a single profound economic problem: According to the Organization for Economic Co-operation and Development, Mexico has the second-highest level of inequality among member nations. More than 50 percent of Mexico's population lives in poverty, and some 14.9 percent of its people live in intense poverty, meaning they have difficulty securing the necessities of life. At the same time, Mexico is home to the richest man in the world, telecommunications mogul Carlos Slim.
Mexico ranked only 62nd in per capita GDP in 2011; China, on the other hand, ranked 91st. No one would dispute that China is a significant national power. Few would dispute that China suffers from social instability. This means that in terms of evaluating Mexico's role in the international system, we must look at the aggregate numbers. Given those numbers, Mexico has entered the ranks of the leading economic powers and is growing more quickly than nations ahead of it. When we look at the distribution of wealth, the internal reality is that, like China, Mexico has deep weaknesses.
The primary strategic problem for Mexico is...

Shanghai, China : Todo apunta hacia abajo ! / All looking down !
Nos referíamos aquí el 6 de Junio el inminente rompimiento del Índice Compuesto de Shanghai. El índice ha roto a la baja no solo la formacion de triángulo pero también se encuentra bajo el promedio móvil de 200 días. Recientemente, 2008, el índice de Shanghai tuvo una violenta caída meses antes de que los mercados en EEUU tocaran fondo en Marzo del 2009. Suerte !
We mentioned here on Jun-6 the coming breakout of the Shanghai Composite Index triangle formation that has been developing for a number of years. Well the breakout has taken place and not only of the triangle formation but now it finds itself below its 200 MA. In 2008 the Shanghai Composite Index had a dramatic drop before the US markets reached their bottom in March 2009. Good Luck !

Corn : +40% in less than 3 months ; Agflation to drive Inflation ahead ?
Some factor impacting the price of food commodities :
Graphs from : Der Spiegel.


- Heat waves ad a changing climate are decimating crops
- More biofuel means less food
- Specualtors drive up prices of agricultural commodities
- New consumptiom patterns exacerbate scarcity
- Emerging economies (China leading) have a bigger middle class
- Increased population
Graphs from : Der Spiegel.


GLD:Estacionalidad del Oro, en Ago. toca fondo / Gold seasonality , Aug. is bottom month
Después de tocar fondo en el mes de Agosto, el precio del oro inicia una recuperación que se extiende hasta el mes de Marzo, para iniciar nuevamente su descenso en Abril de cada año.
After reaching the bottom during the month of August, gold's price start to recover until reaching its peak in March, to re-start its decline in April of every year.

After reaching the bottom during the month of August, gold's price start to recover until reaching its peak in March, to re-start its decline in April of every year.

Suscribirse a:
Entradas (Atom)